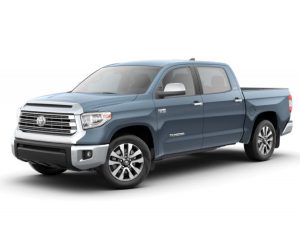
A new study from iSeeCars.com finds that heavy-duty vehicles are among those most likely to retain their value over time in the Roanoke area. On top of that, they are likely to depreciate even less than the national average. iSeeCars is an online automotive search engine and research website. More from WFIR’s Evan Jones:
From iSeeCars.com:
| Cars that Depreciate the Least in Roanoke-Lynchburg, VA | ||||
| Rank | Model | Average New Car Price | Average 5-Year-Old Used Car Price | Average 5-Year Depreciation |
| 1 | Toyota Tundra | $45,374 | $33,744 | 25.6% |
| 2 | Jeep Wrangler | $34,186 | $24,797 | 27.5% |
| 3 | Jeep Wrangler Unlimited | $39,794 | $28,143 | 29.3% |
| 4 | Toyota Tacoma | $34,178 | $23,834 | 30.3% |
| 5 | Toyota 4Runner | $43,185 | $28,172 | 34.8% |
| 6 | Dodge Challenger | $41,239 | $26,580 | 35.5% |
| 7 | Chevrolet Colorado | $31,695 | $19,777 | 37.6% |
| 8 | Honda Civic | $22,651 | $13,408 | 40.8% |
| 9 | Ford Mustang | $36,408 | $21,403 | 41.2% |
| 10 | Ford F-150 | $49,203 | $28,872 | 41.3% |
| Depreciation Average for All Vehicles in Roanoke-Lynchburg, VA: 48.0% | ||||
| Cars that Depreciate the Most in Roanoke-Lynchburg, VA | ||||
| Rank | Model | Average New Car Price | Average 5-Year-Old Used Car Price | Average 5-Year Depreciation |
| 1 | BMW 3 Series | $49,501 | $16,507 | 66.7% |
| 2 | Buick Enclave | $54,234 | $19,310 | 64.4% |
| 3 | Volkswagen Passat | $30,830 | $11,282 | 63.4% |
| 4 | Volkswagen Jetta | $24,972 | $9,232 | 63.0% |
| 5 | Nissan Pathfinder | $41,249 | $15,746 | 61.8% |
| 6 | Volvo XC60 | $48,368 | $18,586 | 61.6% |
| 7 | GMC Acadia | $49,629 | $19,106 | 61.5% |
| 8 | Volvo S60 | $42,370 | $16,416 | 61.3% |
| 9 | Mitsubishi Outlander sport | $24,737 | $9,673 | 60.9% |
| 10 | Nissan Sentra | $21,451 | $8,530 | 60.2% |
| Depreciation Average for All Vehicles in Roanoke-Lynchburg, VA: 48.0% | ||||
| Ranking of Auto Brands in Roanoke-Lynchburg for Value Retention | ||||
| Rank | Make | Avg Price New | Avg Price Used | Average 5-Year Depreciation |
| 1 | Toyota | $33,629 | $20,390 | 39.4% |
| 2 | Jeep | $37,309 | $19,775 | 47.0% |
| 3 | Chevrolet | $38,730 | $20,236 | 47.8% |
| 4 | Ford | $39,127 | $20,295 | 48.1% |
| 5 | Honda | $30,025 | $15,293 | 49.1% |
| 6 | Dodge | $35,047 | $17,299 | 50.6% |
| 7 | Kia | $23,699 | $11,375 | 52.0% |
| 8 | GMC | $49,346 | $22,776 | 53.8% |
| 9 | Hyundai | $24,656 | $11,212 | 54.5% |
| 10 | Nissan | $29,107 | $12,583 | 56.8% |
| 11 | Mazda | $32,483 | $13,454 | 58.6% |
| 12 | Mitsubishi | $21,421 | $8,604 | 59.8% |
| 13 | Volvo | $46,486 | $17,718 | 61.9% |
| 14 | Volkswagen | $27,393 | $10,208 | 62.7% |
| 15 | Buick | $44,184 | $16,003 | 63.8% |


